
Why fixed schedules waste money
In a 2018 survey of 11 South African solar IPPs, 6 cleaned one to three times a year, 36% never washed and waited for rain, and 9% washed six or more times a year. Of the plants that cleaned, 86% used tractor rigs (Naicker 2018). A fixed calendar can’t respond to a dust storm, a dry winter or a wet summer.
Timing is worth real money. In a modelled example for one Californian site, choosing the best cleaning day instead of cleaning at a fixed threshold cut soiling costs by 17% (IEA PVPS 2022). A data-driven 14-day cycle at a utility plant in Senegal cut them by 31% (Diouf et al. 2022). Returns also diminish: in a US example, the annual soiling loss fell from 1.91% to 1.52% with one clean, 1.32% with two and 1.20% with three (NREL 2018).
- No clean1.91%
- One clean1.52%
- Two cleans1.32%
- Three cleans1.20%
Each extra clean saves less than the one before. US example, NREL 2018.
What published case studies show. Chemitek’s case studies with O&M teams show these decisions being made on working plants. See the Vietnam, Chile tracker and Malaysia cases.
Each plan started from that plant’s soiling, equipment and water, and ours do too. For plants where a contaminant has bonded to the glass, the strategy starts with a restoration phase: see Restore → Protect → Maintain.
What the strategy covers
| Element | What we decide |
|---|---|
| Method | Dry or wet; manual brush, rotary brush, water-fed pole, tractor or robot |
| Interval or trigger | Fixed interval, seasonal calendar or a trigger from soiling data |
| Water | Source, quality against the module maker’s limits, treatment and volume per clean |
| Chemistry | Whether a cleaner, coating or removal agent pays back, and at what dilution |
| Equipment | Brushes, dosing, poles, tractors or robots matched to soiling and layout |
| Crew procedure | A method statement: sequence, timing, pressure, PPE and checks |
| Contract KPIs | What the O&M contract measures and pays for |
Dry or wet, and which water
Dry or wet? Dry cleaning saves water and can be enough for loose dust: see soiling losses in South Africa. But dry brushing won’t break cemented dust (IEA PVPS 2022), scale or lichen, and some module makers’ letters of conformity allow wet cleaning only (LONGi’s does). In water-scarce areas, dry cleaning between wet washes can cut water further. Equipment selection compares the tools.
Water. Wet cleaning uses about 1 L/m² per clean in US literature, and a South African dissertation cites about 3 L/m² (NREL 2018; Naicker 2018). Chemitek reports up to 50% less water with Solar Wash Protect or Antistatic Solar Armor 2.0. With tractors and robots the coating’s main effect is faster cleaning: see the Vietnam case. Hard water needs treating first: see water testing.
Intervals and triggers
- Start from the module maker’s default. LONGi asks for cleaning at least every 20–30 days in dry areas and every 40–50 days in rainy areas (LONGi O&M Manual V2.0).
- Then do the economics. The right interval depends on your tariff, soiling rate and what a clean costs, and it changes with the season. The calculator works it out for your plant.
- Then trigger from data. A soiling station shows when the loss has earned the next clean. A rule of thumb reported in South Africa is a constant gap of more than 50 W/m² between cleaned and uncleaned reference cells (Naicker 2018). A cost-based trigger is better.
- Count the rain. Your site’s rainfall pattern goes into the calendar. Soiling losses in South Africa covers how rain affected one Northern Cape plant.
Crew procedure and contract KPIs
A strategy only works if crews can follow it and the contract rewards it. We write a method statement for each task, covering sequence, dilution, pressure, brush type, timing, PPE, safety data sheets and sign-off. Then we write KPIs both parties can check: If an O&M contractor runs your cleaning, we work alongside them.
- soiling ratio after cleaning, from a soiling station;
- energy recovered per clean;
- water used per m²;
- area cleaned per crew-hour;
- incidents: breakages, scratches or cleaning outside the module maker’s conditions.
Chemitek products for this
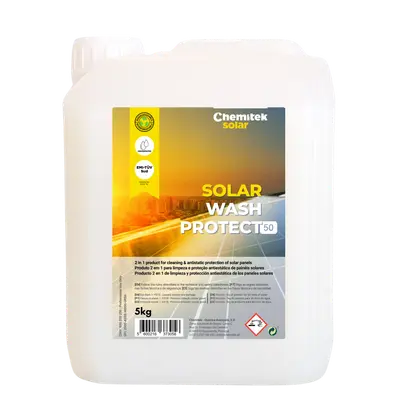
- Clean + protectSolar Wash ProtectConcentrated PV cleaner that leaves an antistatic, anti-adherent layer. 18 module-maker letters of conformity.
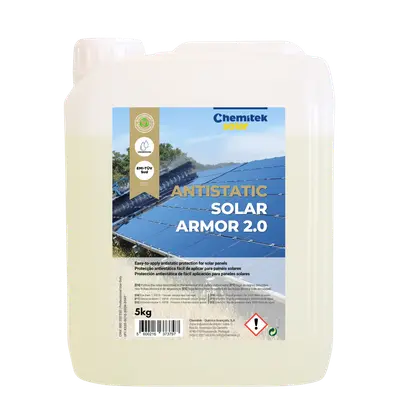
- ProtectAntistatic Solar Armor 2.0Anti-soiling coatings dosed into the wash water at 1 kg to 1,000 L. At least 12 months of protection (Chemitek).
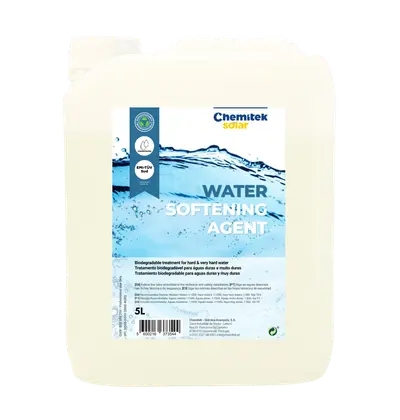
- PreventWater Softening AgentSoftens hard cleaning water in about 20 minutes, so rinses don’t leave scale.
Running your own crews? You can order just these products from us, with or without our engineers.


