
Why does dust build up so fast here?
Long dry spells. Parts of the Northern Cape get under 70 mm of rain a year (SAEON). Rain does clean, but dry spells can last for weeks: see the Kalkbult findings.

Large, dry sources. One study counted 328 dust plumes from 101 sources across Namibia, Botswana and South Africa in 2005–08, from dry lakes, pans and riverbeds such as Etosha and Makgadikgadi (Vickery et al. 2013). Mines and haul roads add dust close to the array.
Dew turns dust into a film. When dew forms on dusty glass, soluble minerals dissolve and recrystallise into bonds that dry cleaning can’t break (IEA PVPS 2022). Loose dust becomes a cemented film that water and dry brushing struggle to shift.
What does it cost?
| Site | Finding | Source |
|---|---|---|
| Northern Cape coating trial | A hydrophobic coating increased soiling: PR gap of up to 5.5% against uncoated | du Plessis et al. (2020) |
| Iron-ore mine dust, India: an analogue for the mines around Kathu and Postmasburg | 63.5% lower maximum power at 5.98 g/m² | Tripathi et al. (2026) |
For measured soiling rates at Kalkbult, near De Aar, see soiling losses in South Africa.
In rands, what a 3% soiling loss costs depends on the tariff the plant sells at. Run your own numbers in the soiling loss calculator.
Energy value at the bid-window tariff, before cleaning costs; bid windows 1–4 in April-2020 rands. The plant makes about 19.9 GWh a year (Global Solar Atlas).
How we diagnose it
- Measure your own soiling rate. Nobody has published peer-reviewed PV soiling rates for Upington, Kathu, Prieska, Kimberley, Namibia or Botswana. We install reference panels, a soiling station or optical sensors and fit the rate as set out in soiling measurement.
- Identify the dust. Loose or cemented, mineral or organic, local or regional. Where composition matters, a sample goes for lab analysis.
- Check your irradiance sensors. IEC 61724 recommends cleaning them weekly; with a clean plane-of-array sensor, temperature-corrected performance ratio can give a good estimate of soiling through a dry season (IEA PVPS 2022). Check yours before trusting a PR trend.
- Test the water. Check the water you would clean with against your module maker’s limits.
- Read the SCADA. On very large plants, a full plant study adds PR analysis and cleaning economics.
How we fix it
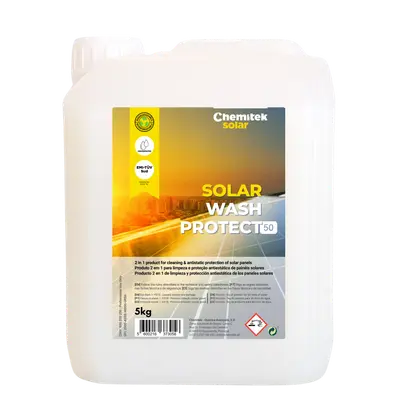
- Loose dust: dry brushing, water or a low-water wash, on a measured interval. For wet washes, Chemitek Solar Wash Protect (SWP 50 at 1 kg to 50 L) lifts dust without abrasion and leaves an antistatic, anti-adherent layer. Chemitek claims up to 5% more energy than water-only cleaning and up to 50% less water; a pilot measures both on your strings. SWP carries 18 module-maker letters of conformity, and crews that already wash can order just the product. See Solar Wash Protect.
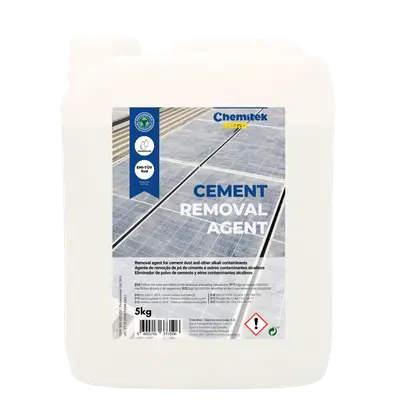
- Cemented films: Chemitek Inorganic Removal Agent dissolves stone dust, gypsum and other alkaline deposits. Start at 1 kg to 2 L of water, apply to dry glass, brush in and rinse. See Inorganic Removal Agent.
- Equipment: tractor brushes, robots or manual crews. See equipment selection.
- CSP mirrors: all of South Africa’s CSP is in the Northern Cape, so the same dust lands on those fields too. See CSP reflectivity measurement.
How to stop it coming back.
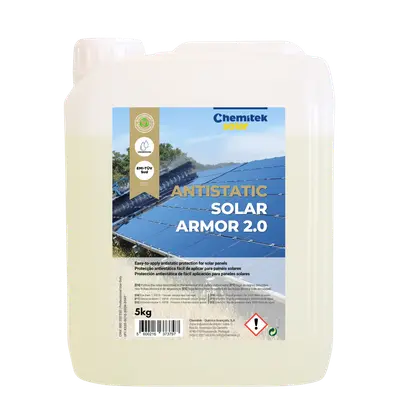
- Prove a coating before you roll it out. Two trials, opposite results: coatings helped in Morocco and made Northern Cape modules dirtier. Antistatic Solar Armor 2.0 works differently from a hydrophobic coating, and we test it the same way. See anti-soiling coatings.
- Clean when it pays. The interval is set from measured soiling, not a copied calendar. See cleaning strategy.
The evidence
Case study: Chemitek (Portugal), with Green Energy Park, Morocco. A nine-month trial on five identical PV systems in semi-arid Benguerir, peer-reviewed in Heliyon (2023) and co-authored by Green Energy Park and Chemitek staff. XRF analysis found the dust rich in calcium oxide, silica and phosphorus pentoxide, which is why we identify dust before choosing chemistry. See the Morocco trial.

Case study: Chemitek (Portugal), with SirajPower, Dubai. Cured cement dust at a desert site, where fortnightly water and rotary brushing had failed. See the Dubai case.

Case study: Chemitek (Portugal), with EDF Energies Nouvelles and Marubeni, Chile. Fine dirt, sand dust and frequent sandstorms on the 115 MWc Santiago Solar tracker plant, coated with D-Solar Defendor through the tractor brush. See the Santiago case.

Case study: Chemitek (Portugal), with Scatec, Honduras. On road dust at a utility plant, Solar Wash Protect beat water-only cleaning. See the Honduras case.
Beyond the Northern Cape
The same dry pans, haul roads and mines shape soiling across Southern Africa, and we work on plants throughout the region, including Namibia, Botswana, Zimbabwe and Mozambique as well as South Africa. The method stays the same everywhere: measure the soiling rate, identify the dust, then design the cleaning.
Dust building up on your plant? Utility-scale and large C&I plants qualify for a free pilot: we measure your soiling first, then prove the method on your strings.
Chemitek products for this
- Clean + protectSolar Wash ProtectConcentrated PV cleaner that leaves an antistatic, anti-adherent layer. 18 module-maker letters of conformity.
- ProtectAntistatic Solar Armor 2.0Anti-soiling coatings dosed into the wash water at 1 kg to 1,000 L. At least 12 months of protection (Chemitek).
- RestoreInorganic Removal AgentDissolves cured cement dust, stone dust and gypsum that water can’t shift. 8 module-maker letters of conformity.
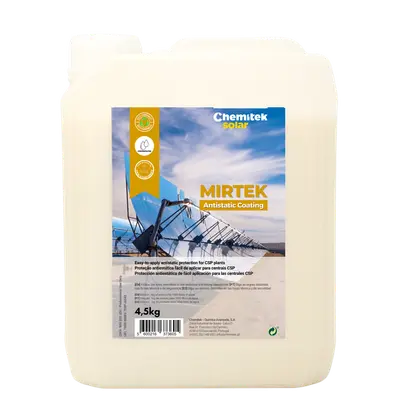
- Protect (CSP)MirtekAntistatic layer for CSP mirrors, applied in the normal wash. Up to 13× slower reflectivity loss in a Chemitek trial at SOLABEN, Spain.
Running your own crews? You can order just these products from us, with or without our engineers.


