What makes the Northern Cape different?
The sun. Near Upington, global horizontal irradiation is about 2,282 kWh/m² a year and fixed-tilt PV yields about 1,993 kWh per kWp (Global Solar Atlas). A 10 MWp plant there makes about 19.9 GWh a year, so each 1% of soiling costs about 199 MWh: roughly R0.22 million a year at the bid-window-4 tariff of R1.10/kWh, in April-2020 rands (IPP Office; our calculation).
The rain. Parts of the province get under 70 mm a year (SAEON), against a national average of about 490 mm (WWF-SA). Between rains, only a clean resets the soiling.
The dust. Between 2005 and 2008, 328 dust plumes were traced to 101 sources, mostly dry lakes, pans and riverbeds in Namibia, Botswana and South Africa, such as Etosha and the Makgadikgadi (Vickery et al. 2013). Mines and haul roads add their own. As an analogue for the iron-ore belt around Kathu and Postmasburg, 5.98 g/m² of iron-ore dust cut maximum power by 63.5% in an Indian study (Tripathi et al. 2026).
The plants. Much of South Africa’s utility-scale PV sits here, and so does all of its CSP: seven plants and 600 MW at 30 June 2025 (van Zyl et al. 2025; CSIR 2025).
What the published data shows
| Where | Finding | Source |
|---|---|---|
| Kalkbult, near De Aar, May–October 2016 | Worst case: a 2.7% clearness-ratio drop and about a 1.9% performance-ratio gap after 75 rain-free days | du Plessis (2017) |
| Kalkbult | About 6 mm of rain every four to six weeks kept uncleaned modules within 1% of cleaned ones | du Plessis (2017) |
| Kalkbult | Dry cleaning and distilled-water cleaning made little or no difference | du Plessis (2017) |
| Northern Cape coating trial | A hydrophobic coating increased dust soiling: a performance-ratio gap of up to 5.5% against an uncoated tracker | du Plessis et al. (2020) |
| Upington, Kathu, Prieska, Kimberley | No peer-reviewed PV soiling rates found | RenewChem literature review (2026) |
Two lessons follow. Rain does real cleaning here when it comes, so plan washes around it, not just before it. And a coating that sounds right can make things worse.
Measure your own soiling rate
With so little local data, a soiling station or optical sensors come before any cleaning plan. We fit the soiling rate as set out in soiling measurement.
Coatings get the same test. Chemitek’s products were tested over nine months in a semi-arid Moroccan trial (Elamim et al. 2023), while in the Northern Cape a hydrophobic coating opened a performance-ratio gap of up to 5.5% the wrong way. We prove any coating on your strings before a plant-wide roll-out. See the Morocco trial.
Water logistics on dry sites
A wet clean uses about 1–3 L per m² of module (NREL 2018; Naicker 2018): roughly 50–150 m³ per full wash on a 10 MWp plant, by our calculation from Ilse et al. (2019).
How we cut the water:
- Dry-clean loose dust. At Kalkbult it matched distilled-water cleaning (du Plessis 2017), within your module maker’s conditions.
- Wet-wash only what dry brushing can’t lift, such as dust that dew has cemented to the glass.
- Test the water at the bowser. Borehole water can be hard, and makers’ limits differ. See water-quality testing.
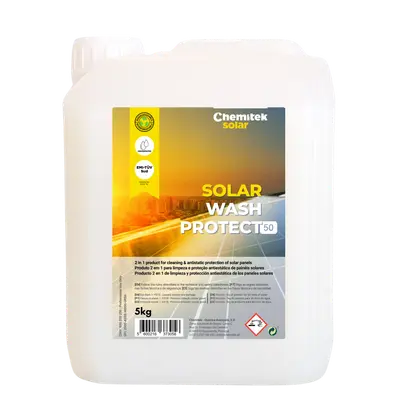
- Use chemistry where it pays. Chemitek claims up to 50% less water with Solar Wash Protect; we measure the real saving on your plant.
More in water-scarce cleaning and desert and mining dust.
CSP mirrors
South African CSP plants hold water-use licences of 1,397–17,900 m³ a year per MW (van Zyl et al. 2025). We measure mirror reflectance and the cleanliness factor, then set wash triggers that balance energy against water. See CSP mirror reflectivity measurement.
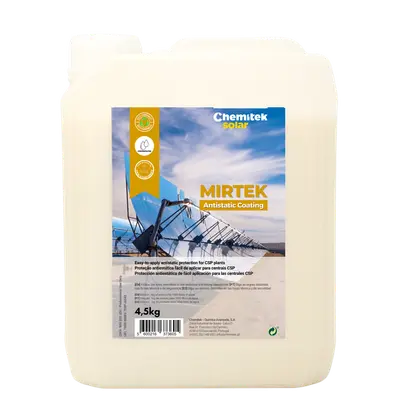
Treatment can keep reflectivity higher between washes. At the SOLABEN CSP plant in Spain, mirrors treated with Chemitek Mirtek by brush lost 0.16% of their reflectivity in 10 days, against 2.17% for untreated mirrors (Case study: Chemitek (Portugal), with Atlantica and Rio Glass Services). See the SOLABEN case.
Start with a pilot, anywhere in the region
Utility-scale and large C&I plants in the Northern Cape qualify for a free pilot: we measure your soiling and water first, then prove the method on treated strings against control strings, under the same sun.
Working beyond the Northern Cape. This page is a regional soiling guide. We work on solar, wind and CSP plants across Southern Africa, including South Africa, Namibia, Botswana, Zimbabwe and Mozambique, and supply Chemitek products throughout the region. Many of the region’s dust sources, its dry lakes, pans and riverbeds, lie in Namibia and Botswana as well as South Africa (Vickery et al. 2013), and the method is the same wherever the plant is: measure first, then design the cleaning.
Chemitek products for this
- Clean + protectSolar Wash ProtectConcentrated PV cleaner that leaves an antistatic, anti-adherent layer. 18 module-maker letters of conformity.
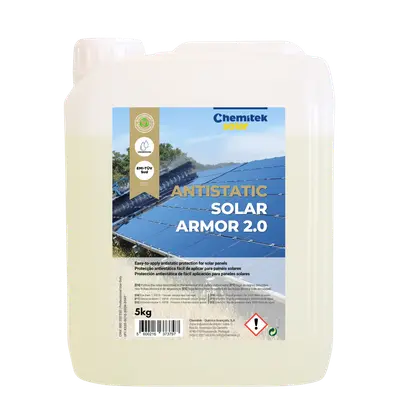
- ProtectAntistatic Solar Armor 2.0Anti-soiling coatings dosed into the wash water at 1 kg to 1,000 L. At least 12 months of protection (Chemitek).
- Protect (CSP)MirtekAntistatic layer for CSP mirrors, applied in the normal wash. Up to 13× slower reflectivity loss in a Chemitek trial at SOLABEN, Spain.
Running your own crews? You can order just these products from us, with or without our engineers.


